BI Tools - メーカー・企業15社の製品一覧とランキング

更新日: 集計期間:Sep 24, 2025~Oct 21, 2025
※当サイトの各ページの閲覧回数を元に算出したランキングです。

BI Toolsのメーカー・企業ランキング

更新日: 集計期間:Sep 24, 2025~Oct 21, 2025
※当サイトの各ページの閲覧回数を元に算出したランキングです。

  1. 芝通アドバンス Niigata//Information and Communications
  2. ウイングアーク1st Tokyo//Information and Communications
  3. エフ・ビー・エス 本社 Tokyo//Information and Communications
  4. NTTデータNJK Tokyo//Information and Communications
  5. クロスユーアイエス 東京支社 Tokyo//Information and Communications

BI Toolsの製品ランキング

更新日: 集計期間:Sep 24, 2025~Oct 21, 2025
※当サイトの各ページの閲覧回数を元に算出したランキングです。

  1. [User Development Case] Visualization of Data Using BI Tools 芝通アドバンス
  2. Report creation and BI tool 'xDB (CrossDB)' エフ・ビー・エス 本社
  3. [Data] Introduction to Data Utilization for Manufacturing DX ウイングアーク1st
  4. BI tool 'DataNatureSmart(R)' NTTデータNJK
  5. 4 Knowledge-sharing BI tool 'DATA KNOWLEDGE' クロスユーアイエス 東京支社

BI Toolsの製品一覧

1~15 件を表示 / 全 63 件

表示件数

Real-time BI tool MotionBoard

A BI tool that aggregates different data sources from Excel to big data onto a single screen and allows for real-time graphing!

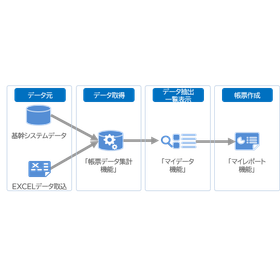
Motion Board meets various data utilization needs in manufacturing sites. By centralizing data that was managed separately for each system and analyzing it from multiple perspectives, you can gain new insights that you may not have noticed before. ◆ Are you facing these challenges? ◆ ◇ Delayed understanding of site conditions, making it difficult to quickly notice problems ◇ Inputting handwritten daily reports into Excel, resulting in time-consuming primary and secondary processing ◇ The occurrence of defective products and yield issues in the production site ◇ Difficulty in quickly detecting equipment anomalies ◇ Data management is fragmented across systems, making it hard to access necessary information immediately We solve these kinds of issues in production, inspection, and reporting operations on-site. ◆ Free trial available now ◆

  • Sales promotion and sales support software
  • Other Software

ブックマークに追加いたしました

ブックマーク一覧

ブックマークを削除いたしました

ブックマーク一覧

これ以上ブックマークできません

会員登録すると、ブックマークできる件数が増えて、ラベルをつけて整理することもできます

無料会員登録

Information visualization BI tool 'MotionBoard'

A BI dashboard that allows anyone, not just experts, to analyze necessary data and utilize information.

"MotionBoard" is a BI dashboard that enhances corporate performance through information visualization and data-driven insights. Even non-experts can intuitively use it thanks to its rich and expressive GUI. It allows for fast, real-time analysis of vast amounts of information. 【Features of MotionBoard】 ■ Input promotion ■ Flexible data integration ■ Streamlining report tasks ■ Real-time monitoring capabilities ■ Supports quick decision-making through chat integration *For more details, please refer to the PDF document or feel free to contact us.

  • BI Tools

ブックマークに追加いたしました

ブックマーク一覧

ブックマークを削除いたしました

ブックマーク一覧

これ以上ブックマークできません

会員登録すると、ブックマークできる件数が増えて、ラベルをつけて整理することもできます

無料会員登録

Case Studies of BI Tool Operations: Creating a Chart Board from Excel

Easily create chart boards using the BI tool 'MotionBoard'.

"Motionboard" excels in data representation and visualization, allowing you to consolidate scattered data into one place and create original boards and graphs. A wide variety of charts suitable for different purposes are available, enabling you to view data from diverse perspectives. Additionally, with forecasting and analytical functions, it is possible to formulate hypotheses and explore issues. 【Features】 ■ Integrates various data sources for centralized management ■ Operable with GUI only, no specialized knowledge required ■ Easy to start and expandable 【Examples】 ■ Sales aggregation analysis ■ Created from sample data in Excel ■ Abundant chart types *For more details, please refer to the PDF materials or feel free to contact us.

  • Database
  • Facility Management System

ブックマークに追加いたしました

ブックマーク一覧

ブックマークを削除いたしました

ブックマーク一覧

これ以上ブックマークできません

会員登録すると、ブックマークできる件数が増えて、ラベルをつけて整理することもできます

無料会員登録

BI Tool Operation Case Studies: Utilizing Excel Aggregation Tables

Utilizing Excel summary tables directly with the BI tool 'MotionBoard'

Excel allows for the free arrangement of values and formulas, making it easy to perform aggregations, which is why many people use it. However, as the volume of data generated daily increases, there are many scenarios where it becomes difficult to achieve data merging, aggregation, and analysis using only Excel. In recent years, the adoption of BI tools has also become more active. On the other hand, do you have concerns about having to process Excel data every time you aggregate it with a BI tool? The BI tool 'MotionBoard' has a feature called "Import Settings" for Excel files, allowing you to use Excel data as is. 【Features】 ■ Excel data can be imported as is, and settings and edits are possible ■ No specialized knowledge is required; operations can be done using only the GUI ■ Easy to start and easy to expand 【Examples】 ■ Sales aggregation analysis ■ Excel aggregation tables ■ Data specification *For more details, please refer to the PDF document or feel free to contact us.

  • Database
  • Facility Management System

ブックマークに追加いたしました

ブックマーク一覧

ブックマークを削除いたしました

ブックマーク一覧

これ以上ブックマークできません

会員登録すると、ブックマークできる件数が増えて、ラベルをつけて整理することもできます

無料会員登録

The visualization tool "MotionBoard" is equipped with a wealth of features.

Over 2,000 companies have implemented it! With MotionBoard, visualization and analysis are within reach.

No specialized or complex programming knowledge is required. You can create expressive dashboards using only mouse operations. ■ Feature 1: Over 30 types of charts In addition to familiar basic charts and summary tables, we offer a wide variety of charts including Pareto charts, heat maps, and scatter plots. For the manufacturing industry, visualization expressions tailored to business needs such as control charts and Gantt charts are possible. ■ Feature 2: Over 10 types of analysis logic We provide a wealth of analysis logic that allows for advanced analysis without programming. This enables in-depth multi-faceted analysis and enhances decision-making. ■ Feature 3: Abundant board samples We offer templates for industries and business needs that are in high demand. These templates are packed with know-how on how to present data not just for confirmation, but in a way that encourages viewers to take the next action. ■ Feature 4: Excel interface (optional) You can transition to a familiar Excel interface to aggregate and analyze data. It is also possible to update data sources from Excel. Modifications for budgets and master data can be easily handled.

  • BI Tools

ブックマークに追加いたしました

ブックマーク一覧

ブックマークを削除いたしました

ブックマーク一覧

これ以上ブックマークできません

会員登録すると、ブックマークできる件数が増えて、ラベルをつけて整理することもできます

無料会員登録

Easily create and distribute reports with MotionBoard.

Automatically execute report creation and distribution, as well as catch changes!

With MotionBoard, you can shorten the time spent on report creation tasks and use it as a foundation for reporting activities in your business. ■ Feature 1: Report Output and Distribution You can output and distribute items from the dashboard to Excel and PowerPoint. This automates daily report creation and distribution tasks. ■ Feature 2: Alert Function It monitors situations based on pre-set thresholds. It can instantly catch changes in sensor data and large amounts of data generated in business operations. Additionally, it can automatically execute processes such as notifications or program execution at that timing. ■ Feature 3: Comment Input and Bulletin Board Function You can add comments to the dashboard, allowing for specific sharing of insights and instructions from analysis results. Furthermore, it enables sharing of related information and communication on the bulletin board.

  • BI Tools

ブックマークに追加いたしました

ブックマーク一覧

ブックマークを削除いたしました

ブックマーク一覧

これ以上ブックマークできません

会員登録すると、ブックマークできる件数が増えて、ラベルをつけて整理することもできます

無料会員登録

The reasons why data analysis using BI is not progressing well.

What is the purpose of data analysis? It is important to master BI tools to continuously perform data analysis!

This document introduces recommendations for building a data analysis infrastructure that can be continuously utilized in business operations. Within various business systems existing in a company, there is a wealth of valuable information, and it is desirable to effectively leverage this information to enhance one's own operations. To achieve this, it is important to build a Data Warehouse (DWH) that serves as the foundation for data analysis and to proficiently use Business Intelligence (BI) tools for ongoing data analysis. [Contents] ■ What is the purpose of data analysis in the first place? ■ Challenges observed in the data analysis process ■ How to create an ideal data analysis infrastructure ■ Tips for utilizing the major trend in BI tools: "Amazon Redshift" ■ The breadth of utilization required for ETL ■ Why ASTERIA Warp is convenient *For more details, please refer to the PDF document or feel free to contact us.

  • IoT

ブックマークに追加いたしました

ブックマーク一覧

ブックマークを削除いたしました

ブックマーク一覧

これ以上ブックマークできません

会員登録すると、ブックマークできる件数が増えて、ラベルをつけて整理することもできます

無料会員登録

BI (Business Intelligence) tool

Data analysis solutions in the production field

When it comes to utilizing information using BI tools, we often see examples such as cross-selling analysis and customer analysis in the retail and distribution industries, as well as sales analysis and area analysis in sales departments. However, recently, the use of information in production sites has also become widespread in the manufacturing industry. Our company utilizes BI tools to promote data utilization in production sites and proposes various improvement activities within the Iwattsu Group.

  • ERP (core system)

ブックマークに追加いたしました

ブックマーク一覧

ブックマークを削除いたしました

ブックマーク一覧

これ以上ブックマークできません

会員登録すると、ブックマークできる件数が増えて、ラベルをつけて整理することもできます

無料会員登録

BI tool that anyone can use: ThoughtSpot

To solve issues like 'I can't find the information I want without searching the dashboard'!

"ThoughtSpot" is a product that enables data visualization using natural language. It allows for easy discovery of hidden insights and the ability to check new data in real-time down to the detail level. Please feel free to contact us if you need assistance. 【Features】 ■ Data visualization using natural language ■ Easy discovery of hidden insights ■ Ability to check new data in real-time down to the detail level *For more details, please refer to the PDF document or feel free to contact us.

  • Database

ブックマークに追加いたしました

ブックマーク一覧

ブックマークを削除いたしました

ブックマーク一覧

これ以上ブックマークできません

会員登録すると、ブックマークできる件数が増えて、ラベルをつけて整理することもできます

無料会員登録

BI tool 'Yellowfin'

A BI tool that quickly analyzes "why it happened" and supports the entire business.

"Yellowfin" is a BI tool that can pursue not only significant changes in data but also the reasons why they occur, presenting this information to users. With an end-to-end analytics platform that encompasses all areas of analysis, including data transformation, automated insights, and collaboration tools, it is capable of covering everything from data transformation to analysis. Furthermore, with automated insights powered by machine learning algorithms, analysts can quickly respond to business challenges, while business users can explore the causes of events from the data themselves. 【Features】 ■ Produce faster and more reliable decision-making ■ Quickly consider "why it happened" and support the entire business ■ Collaborate on data science models *For more details, please download the PDF or feel free to contact us.

  • IoT

ブックマークに追加いたしました

ブックマーク一覧

ブックマークを削除いたしました

ブックマーク一覧

これ以上ブックマークできません

会員登録すると、ブックマークできる件数が増えて、ラベルをつけて整理することもできます

無料会員登録

Comparison of BI Tools: Understanding the Right Selection and Benefits to Avoid Failures in Implementation Consideration

Three benefits of BI tools! Introducing key comparison points necessary for advancing the selection of implementation.

By utilizing BI tools, there are many benefits such as improved operational efficiency and quicker management decisions. To achieve this, it is necessary to understand the basic functions, comparison methods, and advantages. This article introduces the comparison points necessary when proceeding with the selection of BI tools. Please download the attached document for services related to BI tools. *For detailed content of the column, you can view it through the related links. For more information, please feel free to contact us.

  • IoT
  • BI Tools

ブックマークに追加いたしました

ブックマーク一覧

ブックマークを削除いたしました

ブックマーク一覧

これ以上ブックマークできません

会員登録すると、ブックマークできる件数が増えて、ラベルをつけて整理することもできます

無料会員登録

Five features to transform internal data flow.

Introducing five features that transform internal data flows! This will help you understand their usefulness.

Whether you are an analyst or a business user, by using Yellowfin Stories, you can easily create and share data-driven narratives, providing your colleagues with insightful context to prompt action and foster a data-driven culture. This article clearly explains the topic of data storytelling and helps various types of analytics users understand its usefulness. For services related to BI tools, please download the attached materials. *You can view the detailed content of the column through the related links. For more information, feel free to contact us.

  • IoT
  • BI Tools

ブックマークに追加いたしました

ブックマーク一覧

ブックマークを削除いたしました

ブックマーク一覧

これ以上ブックマークできません

会員登録すると、ブックマークできる件数が増えて、ラベルをつけて整理することもできます

無料会員登録

A thorough explanation of the purpose of data analysis by human resources and three key points to be aware of.

It's important to analyze by translating it into data! An introduction to data analysis in human resources.

Data analysis has become increasingly important in human resources. It involves various HR-related matters such as optimizing personnel allocation, improving turnover rates, and reviewing HR systems. Let's back up the HR tasks that have been done based on intuition with data, and carry out better HR operations in a more logical manner. In this article, we will introduce "What data analysis in HR means," as well as "The purposes of conducting data analysis in HR" and "Key points of HR data analysis." For services related to BI tools, please download the attached document. *You can view detailed content of the column through the related links. For more information, feel free to contact us.

  • IoT
  • BI Tools

ブックマークに追加いたしました

ブックマーク一覧

ブックマークを削除いたしました

ブックマーク一覧

これ以上ブックマークできません

会員登録すると、ブックマークできる件数が増えて、ラベルをつけて整理することもできます

無料会員登録

What are the methods for visualizing data? Introduction to benefits and recommended free tools.

Introducing the benefits of visualizing data using BI tools and free tools you can use!

"What does it mean to visualize data?" "I want to know effective methods for visualizing data." "I want to know free tools that can visualize data." In recent years, there has been growing attention on a method called data-driven decision-making, which involves making management decisions based on data analysis. By utilizing big data and making management decisions based on numerical data, it has become possible to make quick and accurate predictions. When utilizing big data, there are BI tools available as data analysis tools. BI tools, short for Business Intelligence tools, are tools that combine numerical data, analyze it instantly, and process it into a format that is easy for anyone to understand. This article introduces methods for visualizing data, the benefits of visualizing data using BI tools, and finally, free tools that can be used. For services related to BI tools, please download the attached document. *For detailed content of the column, you can view it through the related links. For more information, please feel free to contact us.

  • IoT
  • BI Tools

ブックマークに追加いたしました

ブックマーク一覧

ブックマークを削除いたしました

ブックマーク一覧

これ以上ブックマークできません

会員登録すると、ブックマークできる件数が増えて、ラベルをつけて整理することもできます

無料会員登録